Project Overview
Developed a novel approach for stock price prediction using data-driven discovery of partial differential equations. Created a sophisticated sparse regression framework that automatically identifies minimal mathematical relationships governing stock price movements from high-dimensional time series data.
🔬 Traditional Approach
- Method: Vector Auto Regression (VAR)
- Features: Manual lag selection
- Model: Linear relationships
- Limitations: Fixed structure, limited interactions
💰 Our Data-Driven Approach
- Method: Sparse PDE discovery
- Features: Automatic derivative selection
- Model: Nonlinear differential equations
- Advantages: Discovers hidden relationships
Sparse Regression Framework
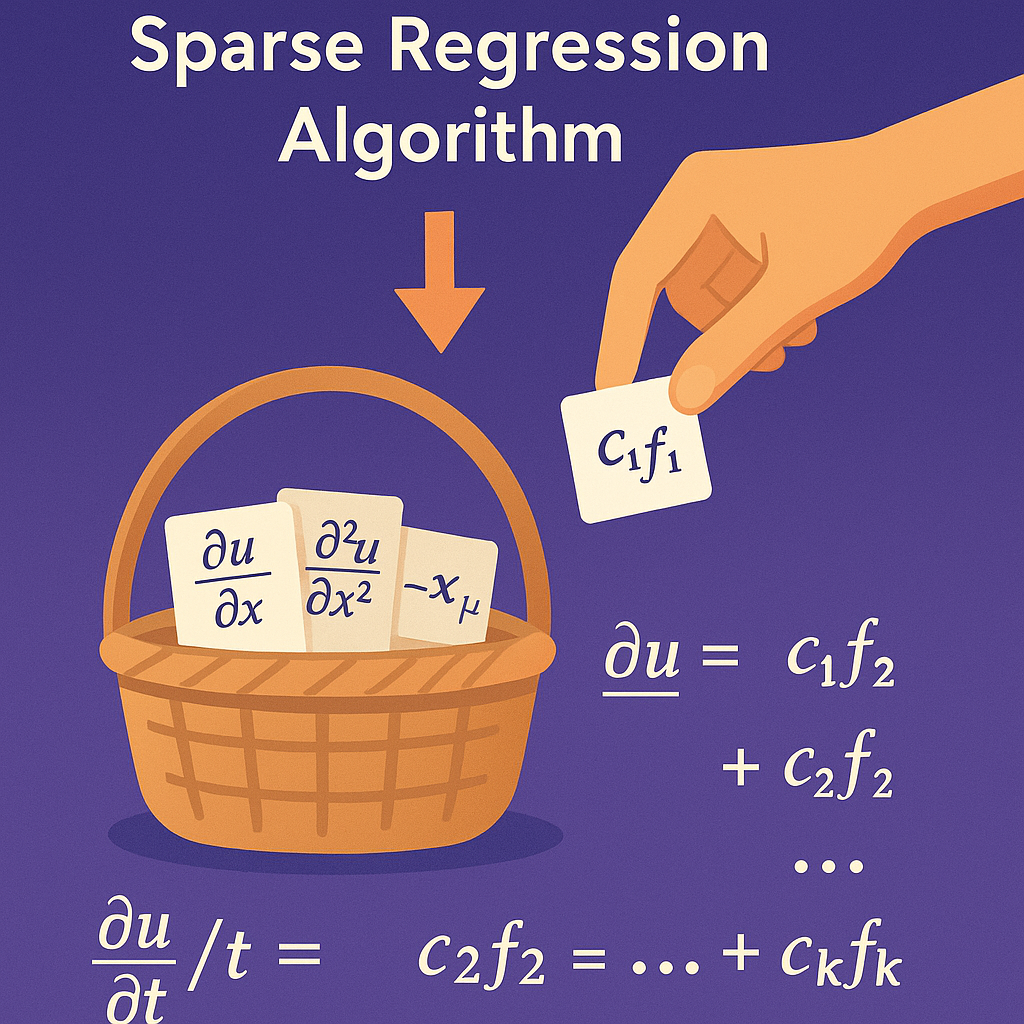
🎯 The Sparsity Challenge
Problem: With 5 stocks and derivatives up to 4th order, the feature space explodes to 1000+ potential terms
Solution: Sparse regression automatically discovers the minimal set of relationships that best predict stock movements
∂u/∂t = N(u, ∂u/∂x, ∂²u/∂x², ..., x, μ)
∂(Stock₁)/∂t = c₁f₁ + c₂f₂ + ... + cₖfₖ
where k << total features (e.g., 8 out of 1000+ possible terms)
Sequential Greedy Sparse Selection
Step 1: Feature Explosion
Create massive library of 1000+ candidate terms from stock derivatives
Step 2: Greedy Selection
Algorithm iteratively selects the single term that most reduces prediction error
Step 3: Sparse PDE Discovery
Result: Minimal PDE with only 5-10 truly predictive cross-stock relationships
Step 4: Temporal Validation
Test discovered PDE by making iterative predictions on out-of-sample data windows
Feature Space Size
1000+ potential terms
Combinatorial explosionSelected Features
5-10 key relationships
Sparse, interpretableSparsity Ratio
~99% reduction
Massive dimensionality reductionEconomic Insight
Discovered relationships
Meaningful market dynamicsSparse Algorithm Deep Dive
Why Sparsity is Critical for Financial Prediction
Without Sparsity:
- 1000+ features → overfitting
- Noise masking real relationships
- Uninterpretable "black box"
- Computational burden
With Sparse Regression:
- 5-10 key features → robust
- Signal extraction from noise
- Interpretable market relationships
- Efficient prediction
Sparse PDE Discovery
Successfully identified minimal mathematical relationships (5-10 terms from 1000+ candidates) governing stock price dynamics
Feature Engineering
Developed comprehensive derivative library including temporal and cross-stock relationships up to 4th order
Algorithm Development
Implemented greedy selection algorithm for automatic discovery of predictive mathematical relationships
Data-Driven Framework
Built sophisticated sparse regression system for extracting meaningful patterns from high-dimensional financial data
Feature Library Construction
Temporal Features
dy₁/dt, d²y₁/dt², d³y₁/dt³
Time-based derivatives1st Order Phase
dy₁/dy₂, dy₁/dy₃, dy₂/dy₃
Cross-stock relationships2nd Order Phase
d²y₁/dy₂², d²y₁/dy₂dy₃
Nonlinear interactionsHigher Orders
3rd & 4th order combinations
Complex market dynamicsFeature Generation: All derivatives computed using central differencing for numerical stability. As derivative order increases, feature space grows exponentially, providing rich representation of market dynamics.
Example: From Time Series to PDE
📊 Input: Multi-Stock Time Series Data
Stock Basket: AAPL, GOOGL, MSFT, TSLA, AMZN
Time Period: 5 years of daily closing prices
Feature Generation: 1000+ derivatives (temporal, cross-stock, higher-order)
Selects 8 most predictive terms from 1000+ candidates
+ 0.156 × ∂(AAPL)/∂t
- 0.089 × ∂(MSFT)/∂(TSLA)
+ 0.234 × ∂(GOOGL)/∂(AAPL)
Use PDE to forecast next time step, then chain predictions forward
Interpretable Relationships
PDE reveals that AAPL price tomorrow depends on GOOGL cross-momentum and MSFT-TSLA interactions
Sparse Discovery
Only 4 terms selected from 1000+ possible features - extracting true signal from noise
Predictive Framework
Mathematical model enables forward prediction through iterative integration
Market Dynamics
Discovered relationships capture actual inter-stock dependencies and momentum effects
Key Innovation: Sparse PDE Discovery for Financial Markets
Developed a sophisticated sparse regression framework to automatically discover minimal mathematical relationships governing stock price movements. This approach extracts meaningful market dynamics from high-dimensional time series data, representing a novel application of data-driven differential equation discovery to quantitative finance.