📊 BLS Employment Sentiment Analysis
🎯 Key Finding
The model successfully detected the COVID-19 labor market shock with unprecedented precision, showing a sentiment plunge from 0 to -9 in March-April 2020.
Technical Approach: Multi-Indicator Aggregation
Method: Weighted composite scoring across 6 labor market indicators
Data Sources: BLS API (no authentication required)
Update Frequency: Monthly
📈 Sentiment Components & Weights
📊 Visualizations
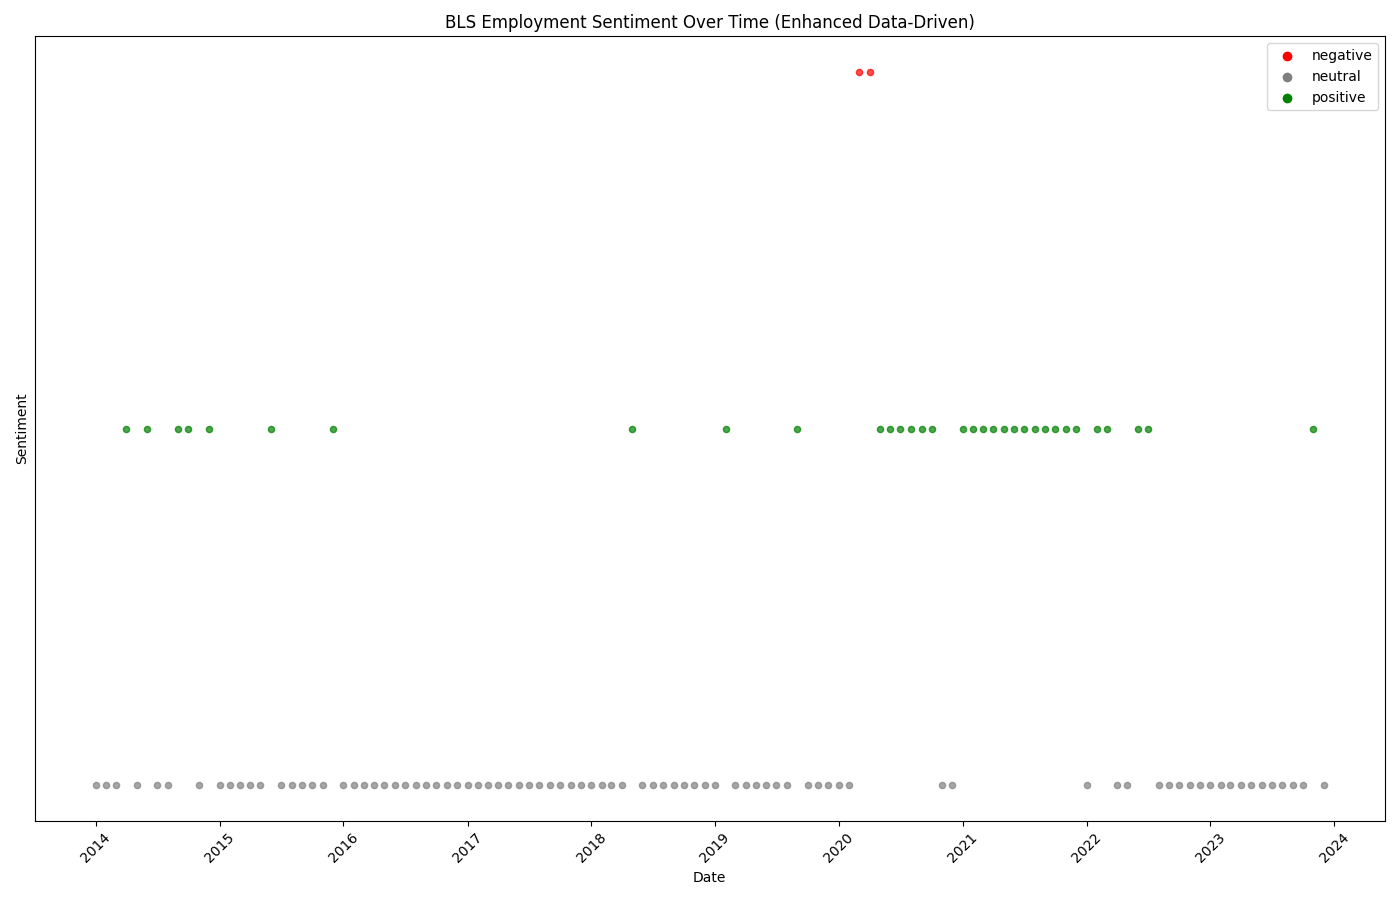
Employment sentiment showing COVID-19 impact in early 2020

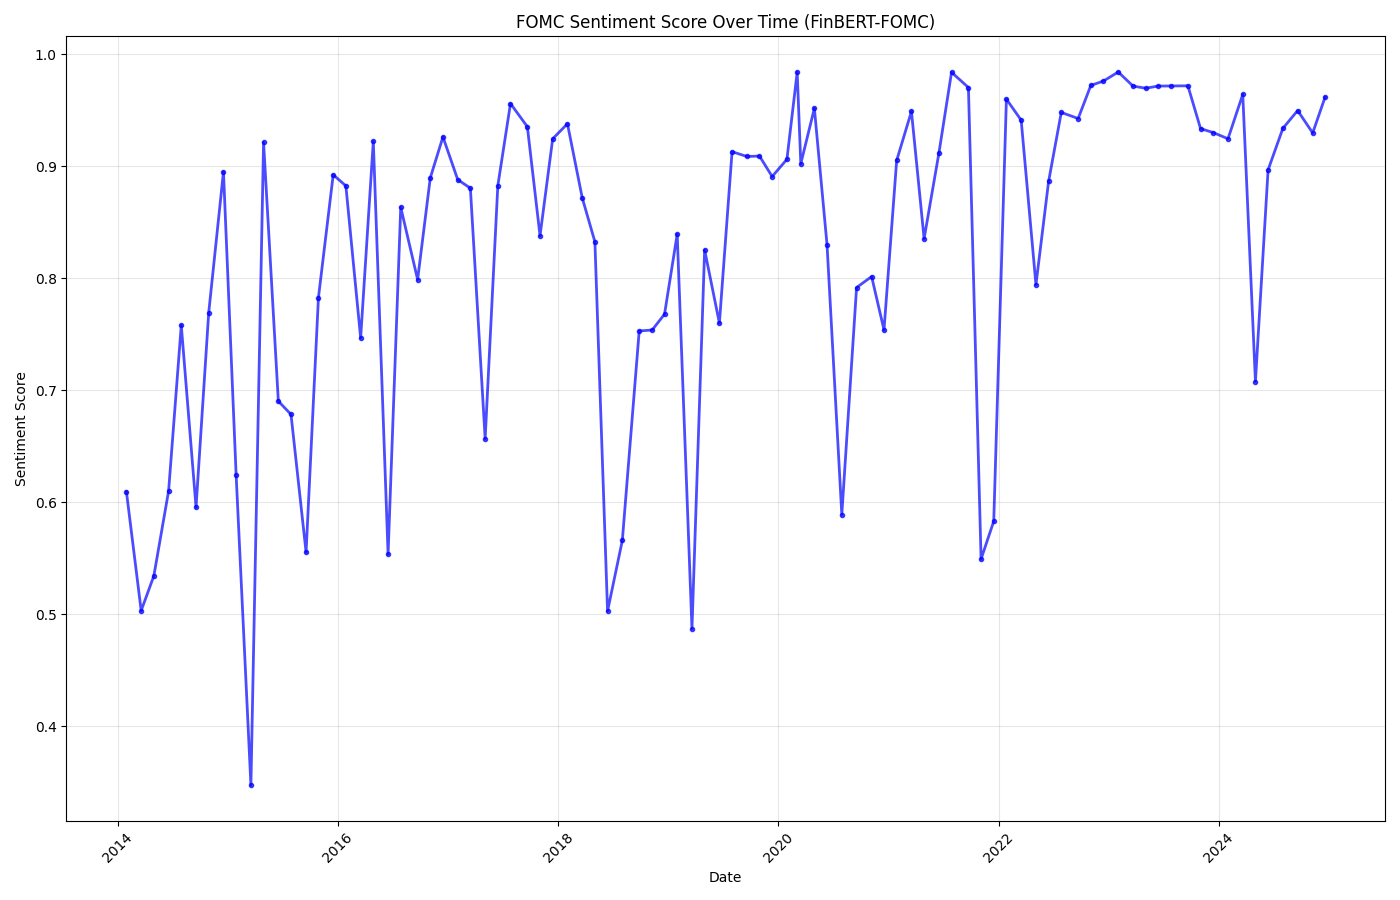
Continuous scores revealing sharp pandemic decline to -9.0 and recovery
🔍 Results Interpretation
Pre-Pandemic (2014-2019)
Consistently positive sentiment with minimal volatility, indicating stable labor market expansion
Healthy BaselineCOVID Shock (March 2020)
Dramatic negative spike to -9.0, the most significant labor market disruption in modern history
Crisis DetectionRecovery (2020-2021)
V-shaped recovery pattern as labor markets rebounded with fiscal stimulus and reopening
Rapid ReboundNormalization (2022-2024)
Return to neutral/positive territory, indicating labor market stabilization
Stable Recovery💡 Workforce Intelligence Applications
- Anomaly Detection: Identify unusual labor market patterns (mass layoffs, hiring surges)
- Temporal Trend Analysis: Track long-term workforce composition shifts
- Multi-Source Integration: Combine employment data from multiple government agencies
- Real-Time Monitoring: Monthly updates for proactive workforce planning
🏦 FOMC Monetary Policy Sentiment
🎯 Key Finding
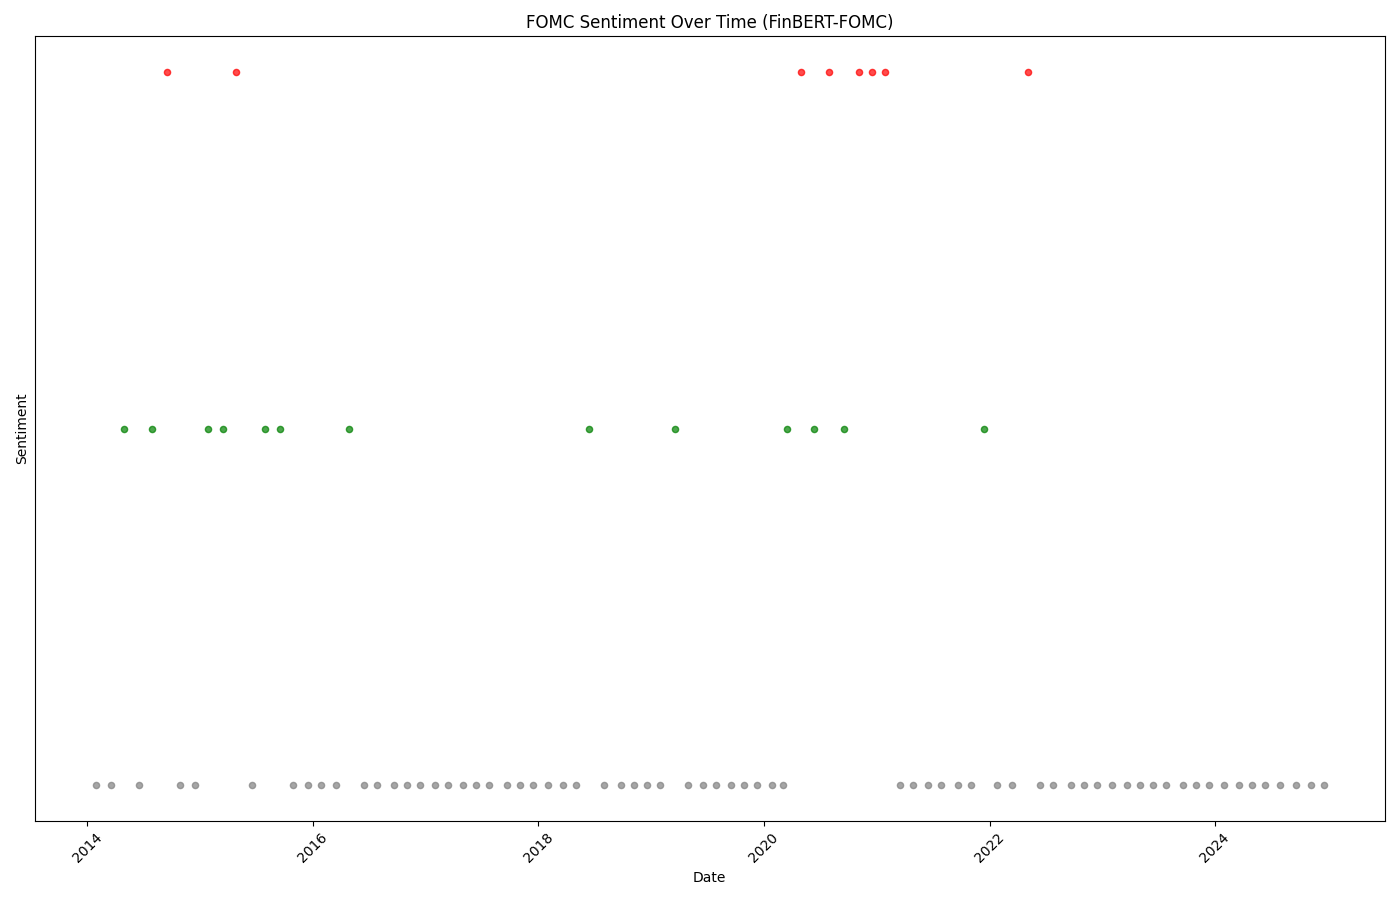
FinBERT-FOMC accurately tracked the Fed's dovish pivot in 2019-2020 and subsequent hawkish turn in 2021-2022 as inflation emerged.
Technical Approach: Transformer-Based NLP
Model: FinBERT-FOMC (pre-trained on Federal Reserve corpus)
Architecture: BERT with financial domain fine-tuning
Confidence Scores: Most predictions 0.7+ (high confidence)
🤖 Model Implementation
📊 Visualizations
📊 Policy Evolution Timeline


2014-2015: Uncertainty
Negative sentiment (0.3-0.6) during taper tantrum and rate liftoff debates
2019-2020: Dovish Pivot
Positive sentiment (0.9+) as Fed cuts rates and responds to pandemic
2021-2022: Hawkish Turn
Negative sentiment clusters as inflation concerns emerge
2023-2024: Stabilization
Return to neutral/positive as policy normalizes
🔬 Technical Advantages
- Domain-Specific Training: Model trained specifically on Fed language and FOMC statements
- Contextual Understanding: BERT architecture captures nuanced policy signals
- High Confidence: Most predictions above 70% confidence threshold
- Automated Scraping: Real-time analysis of new FOMC statements
📄 SEC 8-K Corporate Filing Analysis
🎯 Key Finding
Apple's 8-K sentiment shows 53% positive, 33% negative, 14% neutral filings over 2015-2024, reflecting generally strong corporate trajectory with notable volatility during iPhone transition periods.
Technical Approach: Custom Embedding-Based Analysis
Method: TF-IDF vectorization + custom sentiment axis
Vocabulary: 100+ corporate event terms (positive/negative)
Data Source: SEC EDGAR API with CIK resolution
🎨 Custom Sentiment Axis Construction
📊 Visualizations
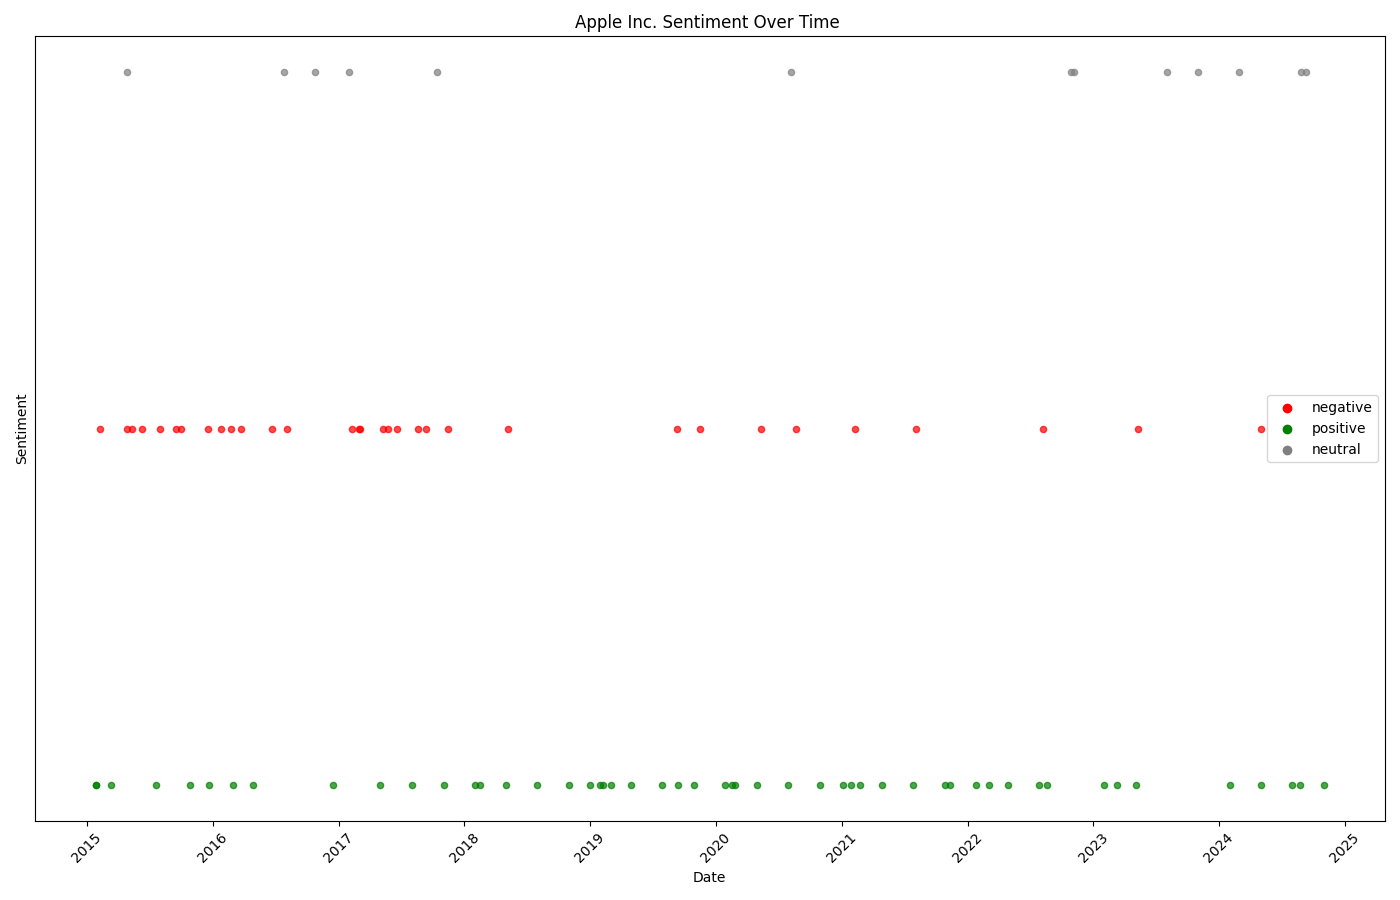

📈 Apple's Corporate Event Timeline


2015-2016: Volatility
Mixed sentiment during iPhone 6S/7 era with varied product reception
2017-2018: Positive Cluster
Strong positive sentiment during iPhone X launch and services growth
2020-2021: COVID Impact
Scattered negative events alongside resilient product launches
2022-2024: Maturation
Return to balanced sentiment with mature product cycles
💼 HR Analytics Applications
- M&A Sentiment Analysis: Track workforce integration during acquisitions
- Restructuring Detection: Identify layoff announcements and organizational changes
- Compensation Events: Monitor dividend/buyback announcements affecting employee stock
- Corporate Health: Early warning system for financial distress impacting employment
🏛️ Treasury Fiscal Policy Analysis
🎯 Key Finding
Treasury policy shows overwhelming expansionary stance across three Secretaries (Lew, Mnuchin, Yellen), with the highest spike (score ~3.0) during 2020 COVID relief measures.
Technical Approach: Semantic Vector Analysis
Method: TF-IDF embeddings projected onto fiscal policy axis
Lexicon: 60+ expansionary/contractionary terms
Coverage: 237 press releases across 2014-2025
⚖️ Fiscal Policy Axis Design
📊 Visualizations
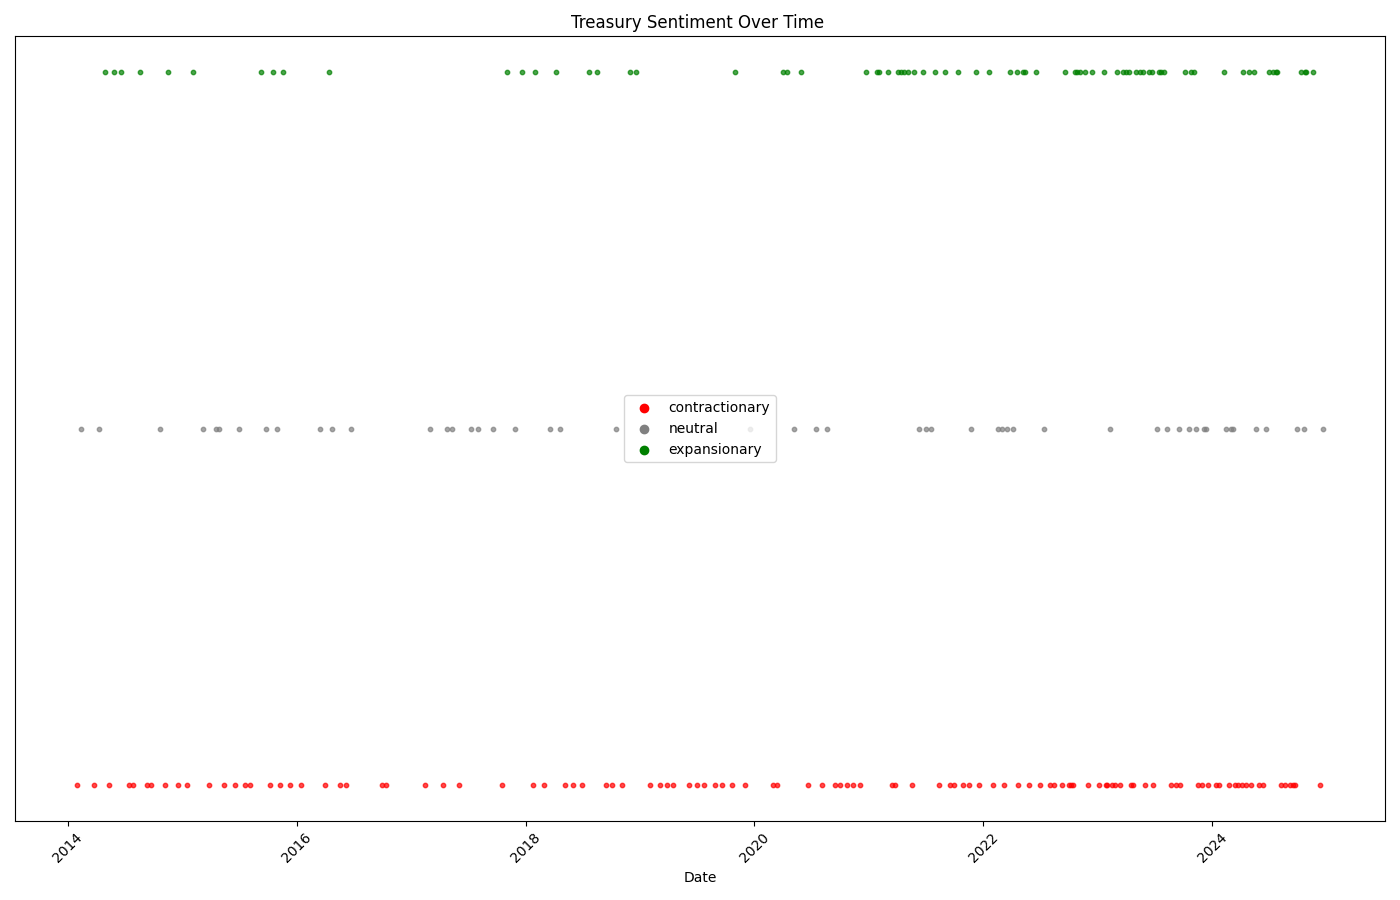
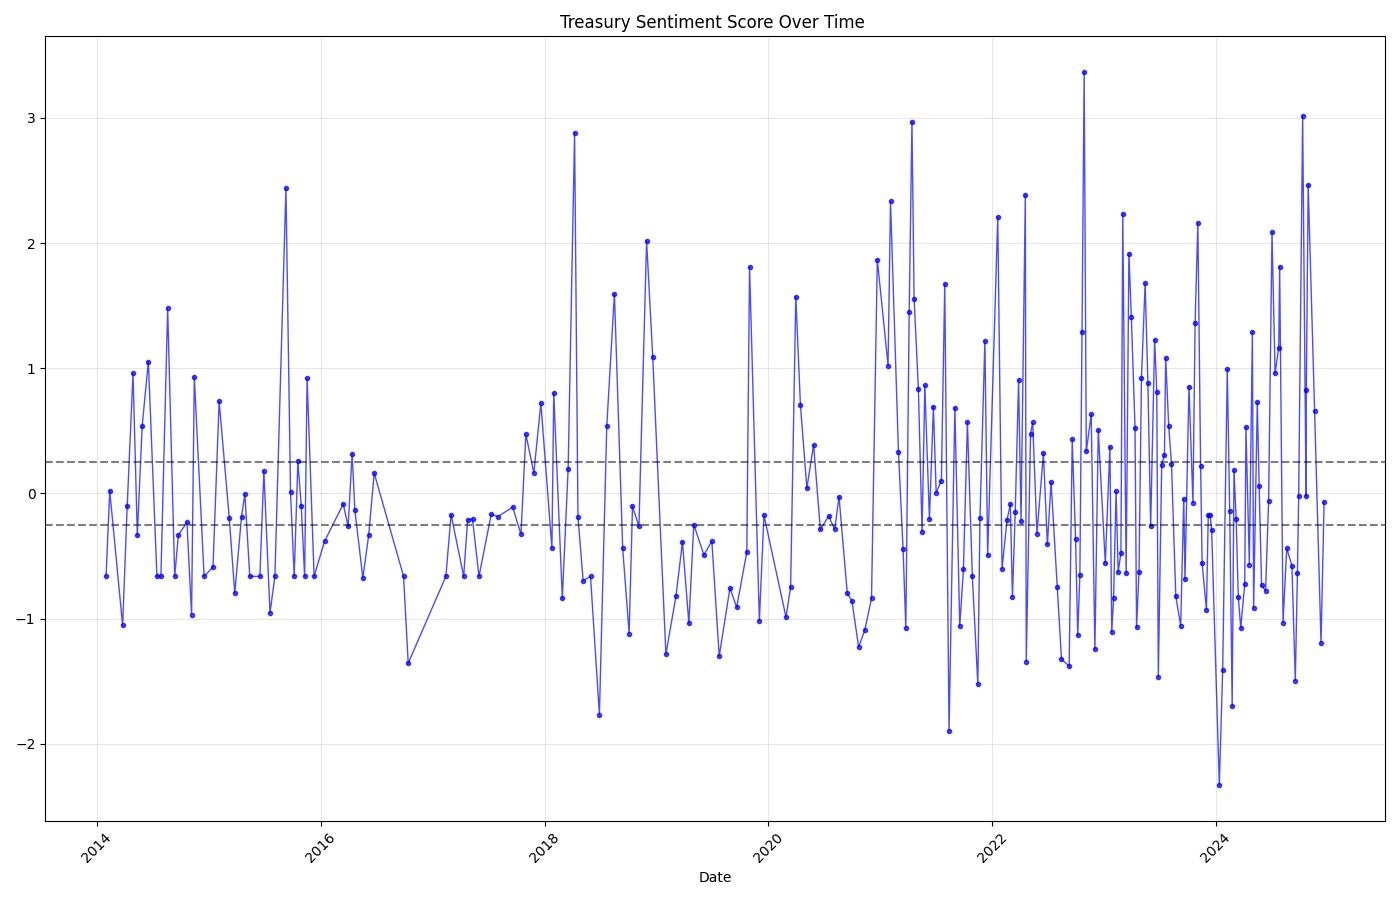
🌊 Policy Evolution Patterns


2014-2019: Recovery Era
Predominantly expansionary during post-recession recovery (Lew/Mnuchin)
Consistent Growth2020: COVID Response
Massive expansionary spike (score ~3.0) during CARES Act implementation
Historic Intervention2021-2022: Infrastructure
Sustained expansion under Yellen with American Rescue Plan
Policy Continuity2023-2024: Moderation
More balanced stance as focus shifts to fiscal sustainability
Stabilization🔍 Workforce Policy Implications
- Job Creation Programs: Expansionary periods correlate with workforce development initiatives
- Infrastructure Hiring: Construction/public works employment tied to fiscal spending
- Public Sector Employment: Government hiring patterns follow fiscal stance
- Skills Training: Investment in workforce development during expansion phases