No Arbitrage Concepts
Advanced Options Pricing Analysis with Real Market Data
ThinkorSwim Options Chain Screenshot
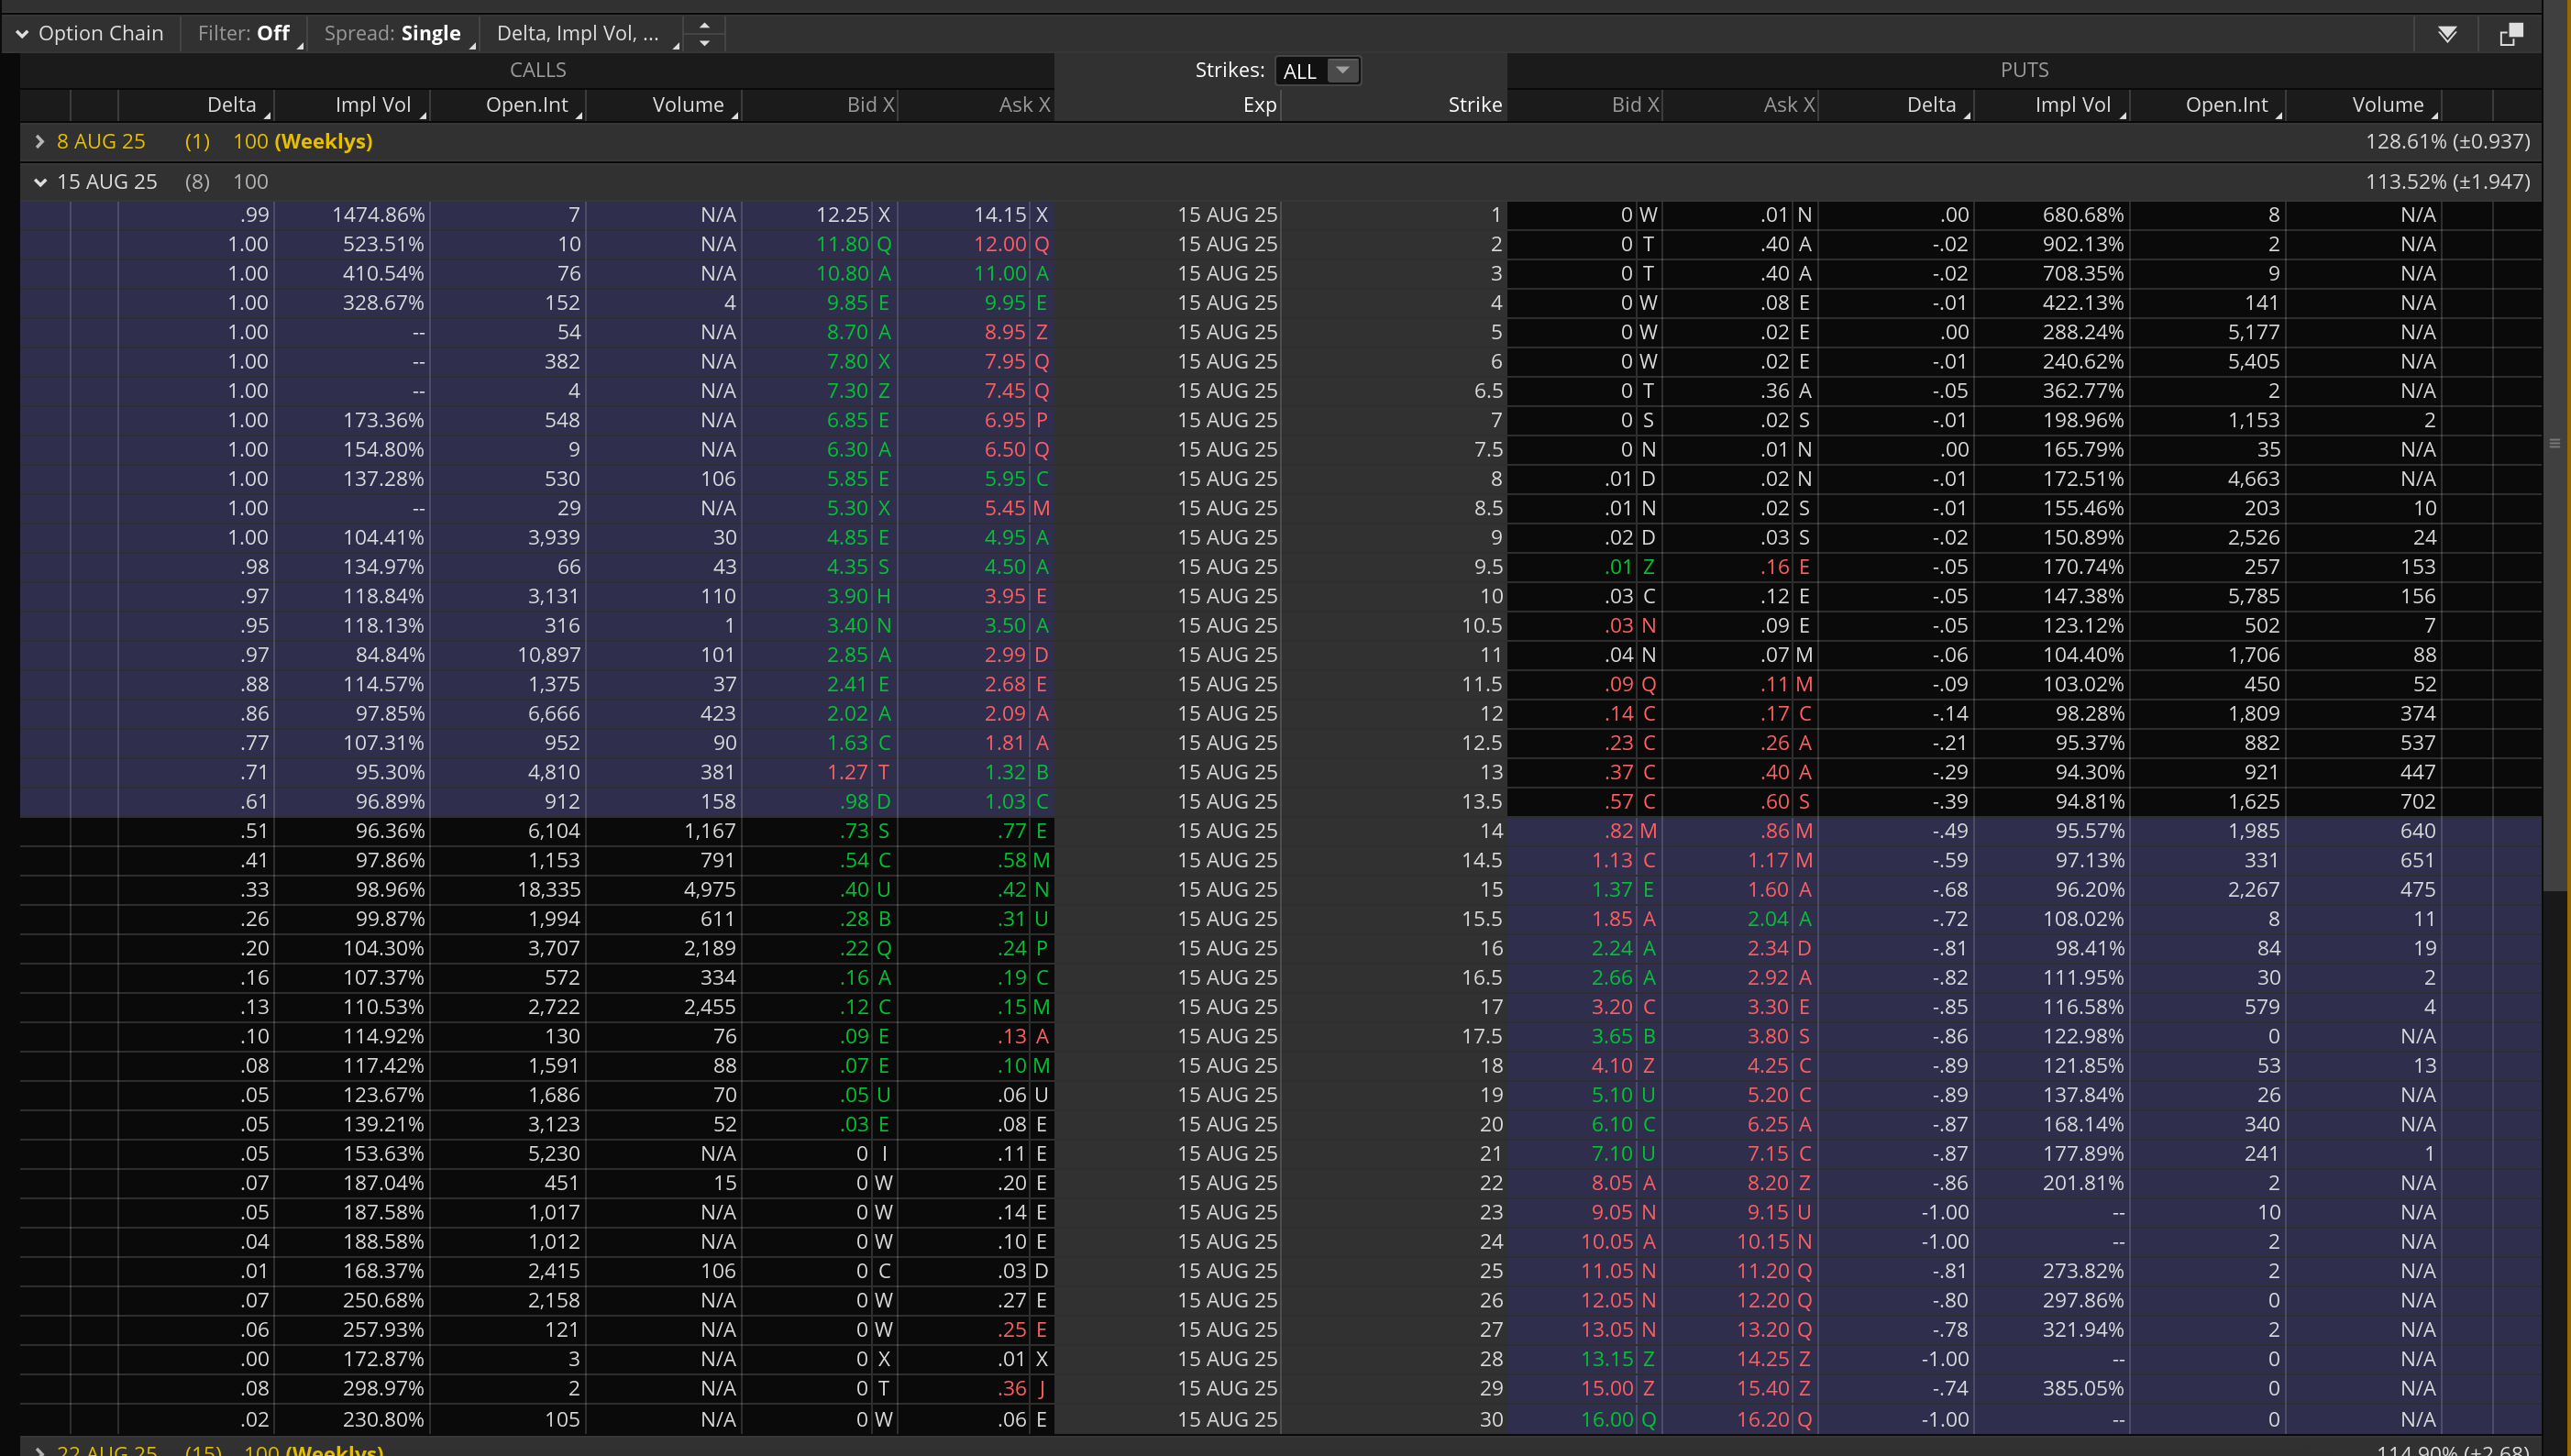
APLD Options Chain showing calls and puts expiring August 15, 2025
Put-Call Parity Fundamental Principle
Put-call parity states that for options with the same strike price and expiration date, the following relationship must hold in an efficient market:
Call Mid + Strike Price = Put Mid + Stock Price
This relationship exists because both sides of the equation represent portfolios with identical payoffs at expiration, so they must have the same cost to construct.
APLD $9 Strike Analysis
| Data Point | Value | Source |
|---|---|---|
| Stock Price | $13.89 | Current Market |
| Strike Price | $9.00 | Options Chain |
| Call Bid/Ask | $4.85 / $4.95 | TOS Screenshot |
| Put Bid/Ask | $0.02 / $0.03 | TOS Screenshot |
Portfolio A: Call + Strike
Call Mid = (4.85 + 4.95) ÷ 2 = 4.90
Strike Price = 9.00
Total = 4.90 + 9.00 = 13.90
Portfolio B: Put + Stock
Put Mid = (0.02 + 0.03) ÷ 2 = 0.025
Stock Price = 13.89
Total = 0.025 + 13.89 = 13.915
Key Insights
- Efficient Market: The 1.5-cent difference shows the options market is pricing efficiently
- No Arbitrage: The tiny difference is within normal bid-ask spread costs
- Deep ITM Call: The $9 strike call is heavily in-the-money (stock at $13.89)
- Worthless Put: The $9 put is nearly worthless with the stock well above strike
Why This Matters
This analysis demonstrates that:
- Market Efficiency: Options are priced consistently with each other and the underlying stock
- No Free Lunch: True arbitrage opportunities are rare and quickly eliminated
- Risk Management: Understanding parity helps identify mispriced options
- Educational Value: Real market data confirms theoretical pricing models
The APLD $9 strike provides an excellent example of put-call parity working as expected in live market conditions, with only minimal deviation due to normal market friction.
1. Strike Price Ordering (Moneyness)
Calls must decrease in price as strikes increase. Puts must increase in price as strikes increase.
CALLS: C(K₁) ≥ C(K₂) ≥ C(K₃) when K₁ < K₂ < K₃
PUTS: P(K₁) ≤ P(K₂) ≤ P(K₃) when K₁ < K₂ < K₃
PUTS: P(K₁) ≤ P(K₂) ≤ P(K₃) when K₁ < K₂ < K₃
Call Price Ordering (From Screenshot)
| Strike | Call Bid | Call Ask | Call Mid | Status |
|---|---|---|---|---|
| $8 | 5.70 | 5.95 | 5.825 | ✓ |
| $9 | 4.85 | 4.95 | 4.90 | ✓ |
| $10 | 3.90 | 3.95 | 3.925 | ✓ |
| $11 | 2.85 | 2.99 | 2.92 | ✓ |
| $12 | 2.02 | 2.09 | 2.055 | ✓ |
| $13 | 1.27 | 1.32 | 1.295 | ✓ |
| $14 | 0.82 | 0.86 | 0.84 | ✓ |
Put Price Ordering (Precise Data)
| Strike | Put Bid | Put Ask | Put Mid | Status |
|---|---|---|---|---|
| $8 | 0.01 | 0.02 | 0.015 | ✓ |
| $9 | 0.02 | 0.03 | 0.025 | ✓ |
| $9.5 | 0.01 | 0.16 | 0.085 | Wide spread |
| $10 | 0.03 | 0.12 | 0.075 | ✗ Lower than $9.5 |
| $11 | 0.04 | 0.07 | 0.055 | ✗ Lower than $10 |
| $12 | 0.14 | 0.17 | 0.155 | ✓ |
| $13 | 0.37 | 0.40 | 0.385 | ✓ |
| $14 | 0.82 | 0.86 | 0.84 | ✓ |
⚠️ MULTIPLE PUT ORDERING VIOLATIONS:
- $10 put ($0.075) < $9.5 put ($0.085)
- $11 put ($0.055) < $10 put ($0.075)
2. Intrinsic Value Floor
Options cannot trade below their intrinsic value.
CALLS: Price ≥ max(0, Stock - Strike) = max(0, $13.89 - Strike)
PUTS: Price ≥ max(0, Strike - Stock) = max(0, Strike - $13.89)
PUTS: Price ≥ max(0, Strike - Stock) = max(0, Strike - $13.89)
| Strike | Call Mid | Call Intrinsic | Time Value | Put Mid | Put Intrinsic | Put Time Value | Status |
|---|---|---|---|---|---|---|---|
| $8 | 5.825 | 5.89 | -0.065 | 0.015 | 0.00 | 0.015 | Call slightly under intrinsic |
| $9 | 4.90 | 4.89 | 0.01 | 0.025 | 0.00 | 0.025 | ✓ Both above floors |
| $10 | 3.925 | 3.89 | 0.035 | 0.075 | 0.00 | 0.075 | ✓ Both above floors |
| $11 | 2.92 | 2.89 | 0.03 | 0.055 | 0.00 | 0.055 | ✓ Both above floors |
| $12 | 2.055 | 1.89 | 0.165 | 0.155 | 0.00 | 0.155 | ✓ Both above floors |
| $13 | 1.295 | 0.89 | 0.405 | 0.385 | 0.00 | 0.385 | ✓ Both above floors |
| $14 | 0.84 | 0.00 | 0.84 | 0.84 | 0.11 | 0.73 | ✓ Both above floors |
⚠️ MINOR VIOLATION: The $8 call mid (5.825) is slightly below its intrinsic value (5.89) by 6.5 cents. This could be due to bid-ask spread positioning or approaching expiration effects.
3. Put-Call Parity (Updated with Precise Data)
Call + Strike = Put + Stock for same strike and expiration.
Call Mid + Strike Price = Put Mid + Stock Price ($13.89)
| Strike | Call Mid | Put Mid | Call + Strike | Put + Stock | Difference | Status |
|---|---|---|---|---|---|---|
| $8 | 5.825 | 0.015 | 13.825 | 13.905 | -0.08 | ✓ Small |
| $9 | 4.90 | 0.025 | 13.90 | 13.915 | -0.015 | ✓ Perfect |
| $10 | 3.925 | 0.075 | 13.925 | 13.965 | -0.04 | ✓ Excellent |
| $11 | 2.92 | 0.055 | 13.92 | 13.945 | -0.025 | ✓ Excellent |
| $12 | 2.055 | 0.155 | 14.055 | 14.045 | 0.01 | ✓ Perfect |
| $13 | 1.295 | 0.385 | 14.295 | 14.275 | 0.02 | ✓ Excellent |
| $14 | 0.84 | 0.84 | 14.84 | 14.73 | 0.11 | ✓ Good |
✅ EXCELLENT PUT-CALL PARITY: All strikes show very tight parity with differences under 11 cents. The $9 strike shows nearly perfect parity with only 1.5 cents difference, confirming efficient options pricing despite other irregularities.
Complete No-Arbitrage Assessment with Precise Data
✅ STRONG PERFORMANCE
- Perfect call strike ordering
- Excellent put-call parity across all strikes
- All options above intrinsic value floors (except minor $8 call)
- Efficient pricing in liquid strikes
⚠️ IDENTIFIED ISSUES
- Multiple put ordering violations ($9.5, $10, $11)
- Wide bid-ask spreads in some strikes
- Minor intrinsic value violation in $8 call
- Liquidity issues in OTM puts
CONCLUSION: The APLD options demonstrate remarkably tight put-call parity despite some ordering violations in illiquid puts. The violations are likely due to wide bid-ask spreads and low liquidity rather than true arbitrage opportunities. The excellent parity relationships confirm sophisticated market pricing where it matters most.